Project title: Knowledge integration and Management Strategy Evaluation modelling
Program: Kimberley Marine Research Program
Modelling the future of the Kimberley region
Ecosim - All Results
In Ecosim Summary we have shown the summary and interpretation of the large amount of data produced by running Ecosim over all selected scenarios. In this page we present the visualisation of all Ecosim model results, displayed either as bar plots or spark line time series as explained here.
The state of the Kimblery marine environment in 2050
In this session we show the state of all indicators and all function groups at the end of the Ecosim simulations (2050), expressed as ratio over the value at the start of the simulation (2015). Time series displaying the system time evolution are shown below.
Indicator bar chart
Below the bar plot of all chosen indicators is shown for all scenarios. The bar plots show the rate of change of variable over its value at the beginning of the simulation. More information on how to read the bar plot is available here. A larger image can be loaded by clicking on the figure of by following the link in the figure caption
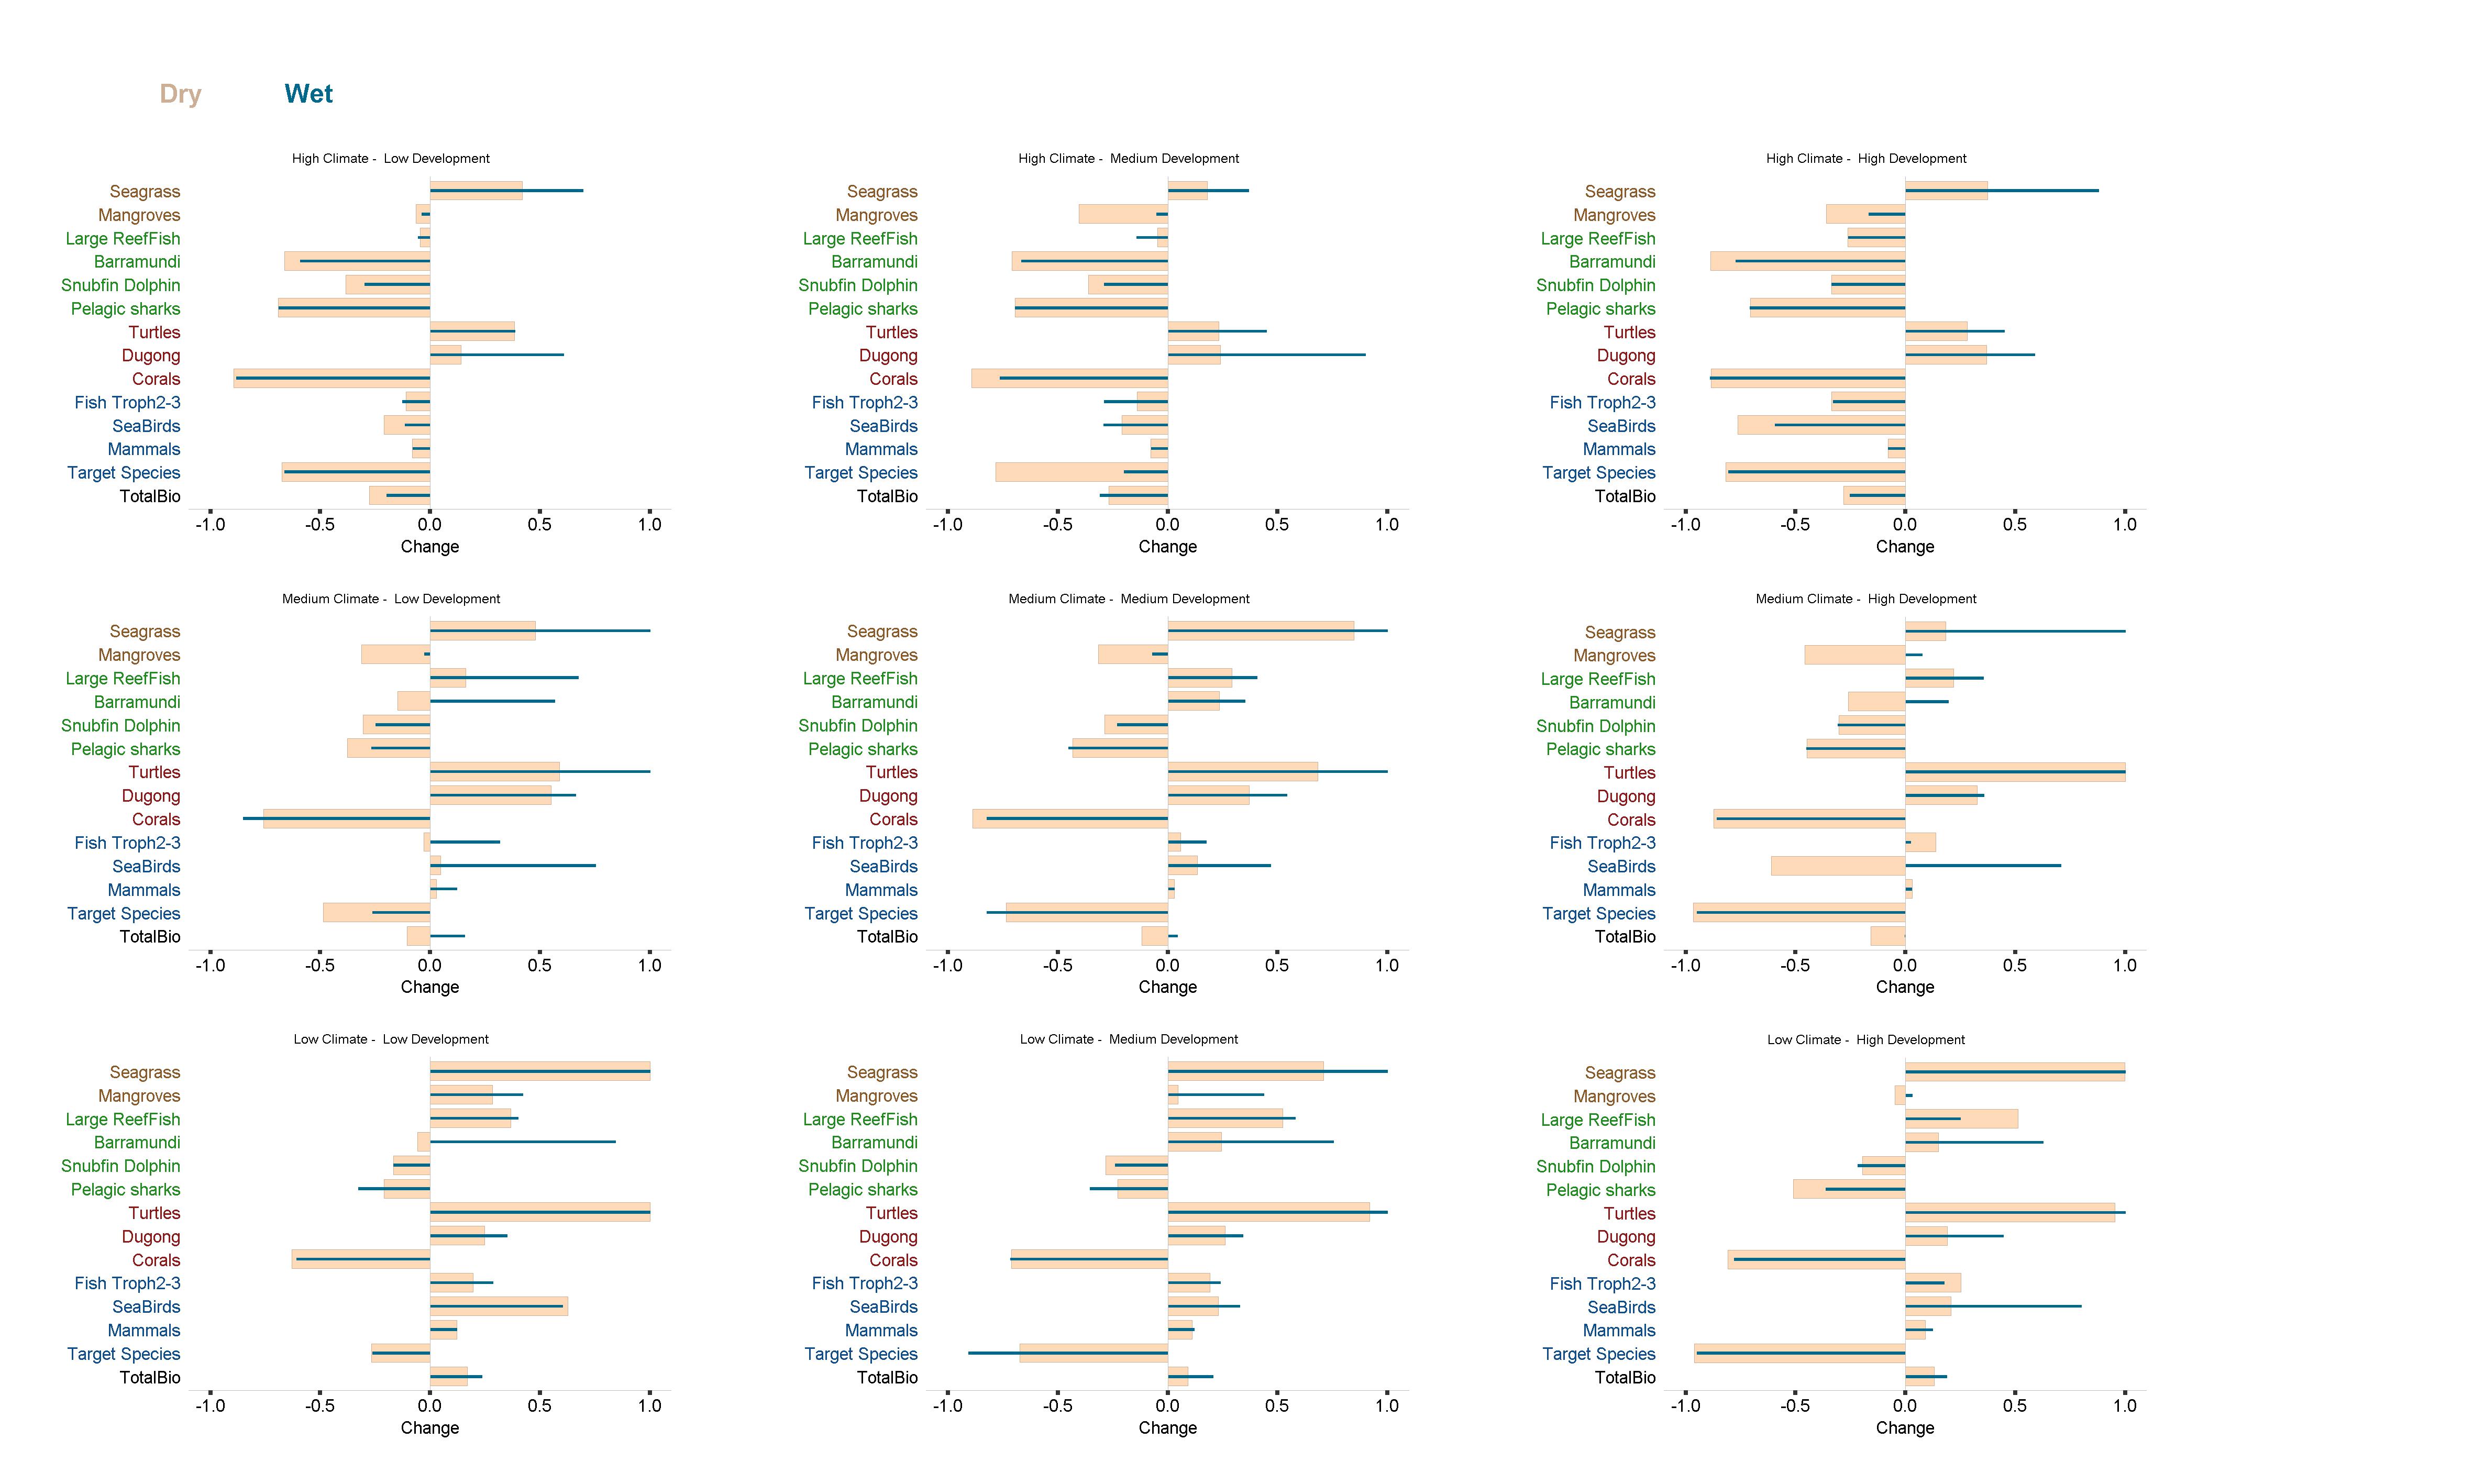 |
| Figure 1. Bar plot of the state of all indicators (y axis) at the end of Ecosim simulation (2050), expressed as ratio of change over the value at the beginning of the simulation (2015). Click here to view a larger figure |
Functional groups bar charts
As above, here we we shown bar plots of all EwE functional groups for all scenarios. The bar plots show the rate of change of variable over its value at the beginning of the simulation. More information on how to read the bar plot is available here.
| High Climate | view bar plots | view bar plots | |
| Medium Climate | view bar plots | view bar plots | view bar plots |
| Low Climate | view bar plots | view bar plots | view bar plots |
| Low Development | Medium Development | High development |
Time evolution
In this section we show the time evolution of all indicators and all EwE functional groups visualised as spark lines, as described here.
Biomass and Divergence indicators - time series
Here we show the time series of the system level indicators (Total Biomass, Divergence and Total Divergence) all scenarios. More information on how to read the time series apsrk lines is available here. A larger image can be loaded by clicking on the figure of by following the link in the figure caption,
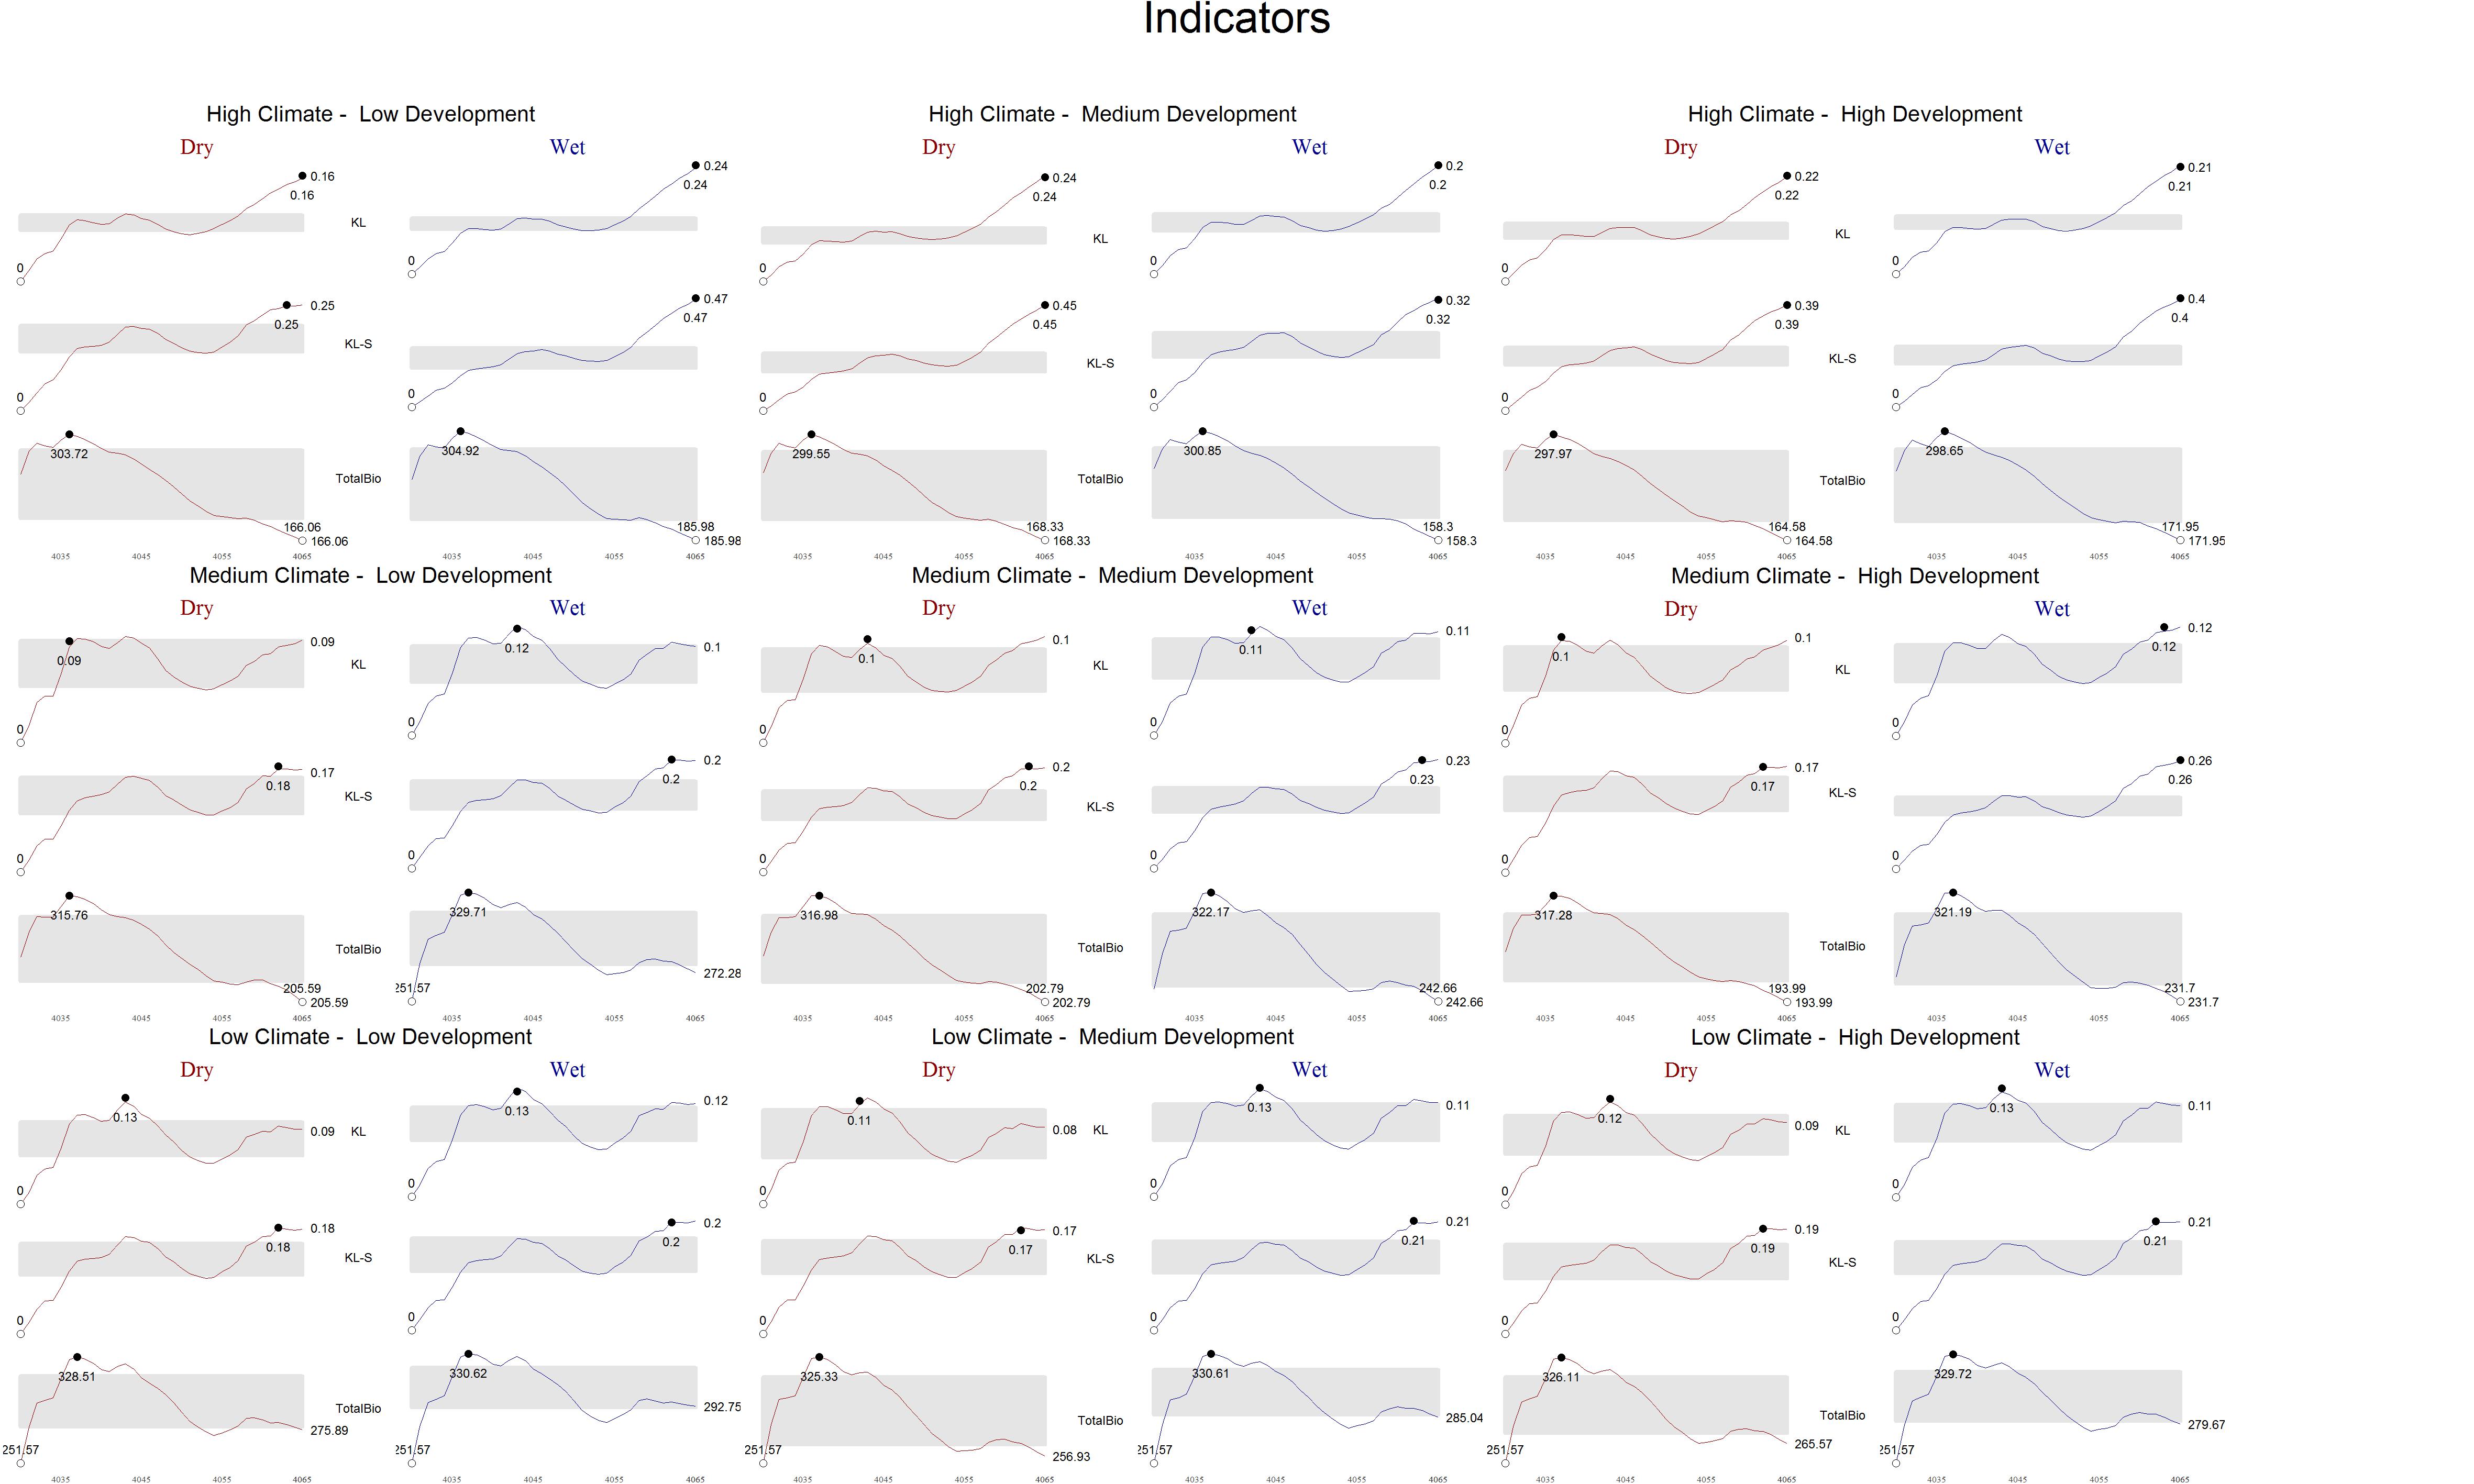 |
| Figure 2. Time series of all indicators expressed as ratio over the value at the beginning of the simulation (2015). Click here for a larger figure |
All indicators - time series
Here, for each scenario, we show the time series of all indicators. More information on how to read the time series is available here.
| High Climate | view time series | view time series | |
| Medium Climate | view time series | view time series | view time series |
| Low Climate | view time series | view time series | view time series |
| Low Development | Medium Development | High development |
All functional groups - time series of individual functional group per scenarios
Here, for each scenario, we show the time series of all EwE functional groups. More information on how to read the time series is available here.
| High Climate | view time series | view time series | |
| Medium Climate | view time series | view time series | view time series |
| Low Climate | view time series | view time series | view time series |
| Low Development | Medium Development | High development |
All functional groups - time series of all scenarios per individual functional group
This section includes the same information as in the previous table, but organised differently. Here, for each EwE functional group, we show the time series for all scenario. More information on how to read the bar plot are available here.
All functional groups - Raw Data - time series of all scenarios per individual functional group
In the previous section, time series had been downsampled (one sample per year) and normalised to the starting biomass, to simplify the visual analysis. For completeness, here we show the raw times series as generated by Ecosim. The time series are sampled monthly and the magnitude reflects the actual species biomass. For each EwE functional group, we show the time series for all scenario. More information on how to read the bar plot are available here.