Project title: Knowledge integration and Management Strategy Evaluation modelling
Program: Kimberley Marine Research Program
Modelling the future of the Kimberley region
The Scenarios
How the scenarios were selected
Scenarios are generally defined as plausible, challenging, and relevant stories about how the future might unfold [1-3]. To be relevant to this study, a scenario needs to be pertinent to the ecological, economic and social development of the Kimberley region and its marine environment in particular. In addition, a scenario needs to be amenable to computer simulation. Obviously, the number of scenarios of interest which may occur is too large to model exhaustively and to analyse comprehensively. This problem is common to any project which attempts to say anything meaningful about the future and requires a careful selection of a small set of scenarios which is representative of the overall range of relevant stories of interest [2, 4].
Selecting a manageable set of scenarios is carried out differently in different disciplines. The first step is usually to define the main components of a scenario, that is what core issues or events a scenario needs to include. In our case, this means asking what events or issues may be most relevant to the future of the Kimberley marine environment. This includes, for example, weather, climate and other natural processes as well as human and social processes like population growth, resource use and development (for different industrial, agricultural and commercial sectors), attitudes towards the environment, political choices, etc.
One approach to defining scenarios focusses on the combinations of the paths each of these events or issues may take. This ensures that a wide range of future events are considered but quickly leads to a very large number of scenarios. For example, considering 10 issues or events, and assuming that each issue could play out in 3 different ways (low, medium or high change), would lead to ~60,000 scenarios. Not only would all these scenarios be difficult to simulate, but they would be very difficult to analyse in a meaningful way and, importantly, to compare with one another.
A different approach is followed in the Future Studies and Foresight literature [5-9]. In this tradition, a future is usually explored via stakeholder engagement rather than via modelling. Participants are asked to identify the two most critical and uncertain drivers of change which define the axes of a 2D plane. This plane is then divided into four quadrants, each defining a single scenario as the interplay of the two axis [2, 9-11]. This approach is often referred to as double uncertainty or 2 by 2 and the 2D plane is referred to as Futures Plane [4]. The double uncertainty approach results in no more than a handful of scenarios (as recommended in the Future Studies literature [12, 13]), which can however be analysed at depth and easily compared.
The approach we follow in this work is a compromise between the two just described. Its rationale is that events in the real world do not happen randomly or even independently. For example, weather events are highly correlated, which is why the concept of climate is useful. Similarly, population growth, economic growth, resource use and development are often correlated, which is why at times we talk of political or economic climate. Even more important, at the time and spatial scales we address in this study, individual events often average out and it is the broader trends resulting from their correlations which matters most. As a result, following the Future Studies and Foresight literature, we employ a double uncertainty approach in which trends in Climate Change and Economic Development are identified as the two most critical and uncertain drivers of change. These are acknowledged as the most important stressors on the Kimberley marine environment by most of our stakeholders and reflect the core aspiration of ensuring i) environmental and cultural sustainability, ii) economic and social progress and iii) resilience to climate change. The Climate Change and Development axes thus define the Future Plane shown in Figure 1. We depart from the Future Studies and Foresight literature in three ways important. First, rather than focussing on only 4 quadrants we subdivide each axis into three levels of increasing pressure: low, medium and high. This results in 9 (3 by 3) scenarios, and allows for a finer exploration of possible futures. Second, for each axis, we spell out how each specific process pertaining to that dimension contributes to that level of pressure (see sections below). Third, for some scenarios, we plan to perform a sensitivity analysis by studying how small variations in pressure impact the model output. We believe this approach offers the most effective option, given the resources available to the project and the need to provide model results in such a way that are easily understood, compared and incorporated into the decision making process. In summary: :
- We analyse nine scenarios resulting from the interplay of low, medium and high Climate Change and Development impacts
- Some of these scenarios will be subjected to stochastic Monte Carlo analysis to establish the model sensitivity to small changes in impacts.
- Each dimension (Climate Change and Development) accounts for a number of components (see below). These components are assumed to be highly correlated and thus will change in unison, that is, changes to each individual component is not analysed in this study
- however, how each component contributes to a dimension is spelled out in the model input. As a result, should a specific trend in a specific component be deemed important at a later stage, this could be easily addressed in a separate project.
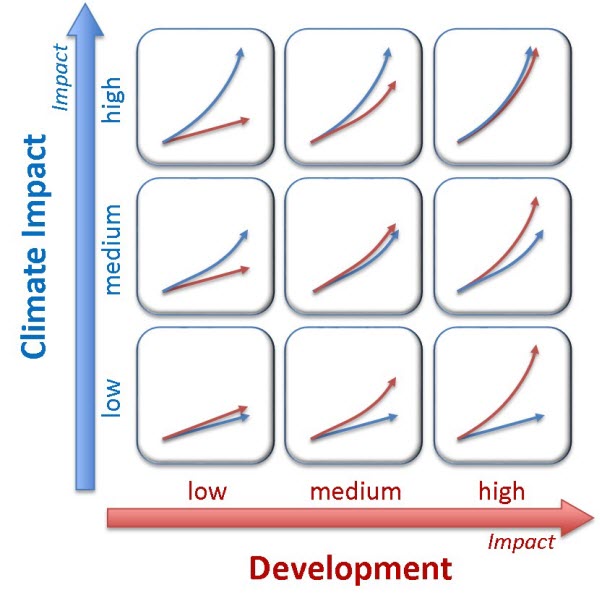 |
| Figure 1. The 3 by 3 Future plane consisting of The Climate Change and Development axes. Each axis is subdivided into low, medium and high impact, resulting in 9 scenarios describing the interplay between Climate Change and Development stressors. |
Climate Change scenarios
The climate change scenarios are based on the simulations produced within a CSIRO internal strategic project and the WAMSI 2.2.7 project Knowledge integration and predicting biophysical response to climate change. The projects use a near-global eddy-rich Ocean General Circulation Model OFAM3, to downscale the future changes of global ocean circulation based on the Representative Concentration Pathways (RCP) 8.5 climate model projections [14]. The RCP8.5 is based on upon a revision and extension of the IPCC A2 scenario [15].
Climate models explore the global climate impacts of different pathways of greenhouse gas emissions, arising from different scenarios of population growth, economic development, technological progress and policy choices. Of all the Representative Concentration Pathways projections, RCP8.5 assumes the highest greenhouse gas emissions resulting from high population growth, slow average income growth, modest rates of technological change and energy intensity improvements, and poor climate change policies. In other words, RCP8.5 represents a worst case scenario of business-as-usual carbon intensive economic growth in the absence of coordinated mitigation initiatives, leading to a radiative forcing of 8.5 W/m2 by the end of the century, a projected average global warming of 2.0oC (1.4-2.6 oC range) and a projected global mean sea level rise of 0.30m (0.22-0.38m range) by mid-century (2046-2065). It is thus natural to adopt this as the High Climate Change scenario for the model simulations. Information about all the RCP scenarios and projections is also available at http://sedac.ipcc-data.org/ddc/ar5_scenario_process/RCPs.html/.
As a result of discussions with WAMSI 2.2.7 project leader Dr Ming Feng, it was agreed that the Low and Medium Climate Change scenarios will be obtained by scaling the output of the OFAM3 model as produced by the WAMSI 2.2.7 project. In particular, this scaling will be carried out by associating a radiative forcing of 4.5 W/m2 and 2.6 W/m2 to the Medium and Low Climate Change scenarios, respectively, which correspond to the RCP4.5 scenario (1.4oC [0.9-2.0] warming and 0.26m [0.19-0.33] sea level rise) and the RCP2.6 (1.0oC [0.4-1.6] warming and 0.24m [0.17-0.32 sea level rise) scenario, respectively. The Climate Change scenarios are summarised in Table 1.
| Table 1. Description of the Climate Change scenarios | ||||||||||||
|
Development scenarios
The development scenarios account for a large number of sectors, including population, housing, tourism, agriculture (including the Ord River Irrigation Scheme and other forage and horticultural crops), cattle farming, aquaculture (pearl, prawns and barramundi), transport, infrastructure, mining (iron ore, diamonds, gold, copper zircon and gravel) and Oil & Gas. Exact details about these scenarios, the rationale for their choice and the implications for each sector can be found in the attached document A Synopsis of Alces Online Methodology and Key Land Use Trajectories Coefficients for the WAMSI Kimberley Project produced by the Alces modelling team, while Table 2 summarises the key features of each scenario.
| Table 2. Brief description of the Development scenarios. More details can be found in document A Synopsis of Alces Online Methodology and Key Land Use Trajectories Coefficients for the WAMSI Kimberley Project. | ||||||||||||||||||||||||||||
|
References
- Bezold, C., Lessons from using scenarios for strategic foresight. Technological Forecasting and Social Change, 2010. 77: p. 1513-1518.
- Hunt, D.V.L., et al., Scenario Archetypes: Converging Rather than Diverging Themes. Sustainability, 2012. 4: p. 740-772.
- Raskin, P., et al., Global scenarios in historical perspective, in Ecosystems and Human Well-being, S.R. Carpenter, et al., Editors. 2005, Island Press: Washington, DC. p. 35-44.
- Boschetti, F., J. Price, and I. Walker, Myths of the Future and Scenario Archetypes. Technological Forecasting & Social Change, 2015. in print.
- Alford, K., et al., The Challenges of Living Scenarios for Australia in 2050. Journal of Futures Studies, 2014. 18: p. 115-12.
- Bezold, C., Jim Dator's Alternative Futures and the Path to IAF's Aspirational Futures. Journal of Futures Studies, 2009. 14: p. 123-134.
- Bootz, J.-P., Strategic foresight and organizational learning: A survey and critical analysis. Technological Forecasting and Social Change, 2010. 77: p. 1588-1594.
- Kok, K., et al., Report on the New Methodology for Scenario Analysis, Including Guidelines for Its Implementation, and Based on an Analysis of Past Scenario Exercises. 2011, The CLIMSAVE Project.
- Curry, A. and W. Schultz, Roads Less Travelled: Different Methods, Different Futures. Journal of Futures Studies, 2009. 13: p. 35-60.
- Raven, P.G., The future's four quarters: Proposing a quadrant methodology for strategic prototyping in infrastructural contexts. Technological Forecasting and Social Change, 2014. 84: p. 115-130.
- Ramirez, R. and A. Wilkinson, Rethinking the 2*2 scenario method: Grid or frames? Technological Forecasting and Social Change, 2013.
- Durance, P. and M. Godet, Scenario building: Uses and abuses. Technological Forecasting and Social Change, 2010. 77: p. 1488-1492.
- De Vries, B., Scenarios: guidance for an uncertain and complex world?, in Sustainability or collapse?, R. Costanza, L. Graumlich, and W. Steffen, Editors. 2007, MIT Press: Cambridge.
- Riahi, K., et al., RCP 8.5-A scenario of comparatively high greenhouse gas emissions. Climatic Change, 2011. 109(1-2): p. 33-57.
- Riahi, K., A. Grubler, and N. Nakicenovic, Scenarios of long-term socio-economic and environmental development under climate stabilization. Technological Forecasting and Social Change, 2007. 74(7): p. 887-935.
- Pinnegar, J., et al., Alternative future scenarios for marine ecosystems. 2006, The University of East Anglia.
- Symons, J. and F. Boschetti, How Computational Models Predict the Behavior of Complex Systems. Foundations of Science, 2012: p. 1-13.