Project title: Knowledge integration and Management Strategy Evaluation modelling
Program: Kimberley Marine Research Program
Modelling the future of the Kimberley region
Strategy Analysis (Ecospace) - Summary Results
Following on the results of the cluster analysis applied to the 18 modelled scenarios, here we discuss the impact of the management strategies applied to the representatives of the High, Medium and Low Pressure scenario clusters (see Figure 1).
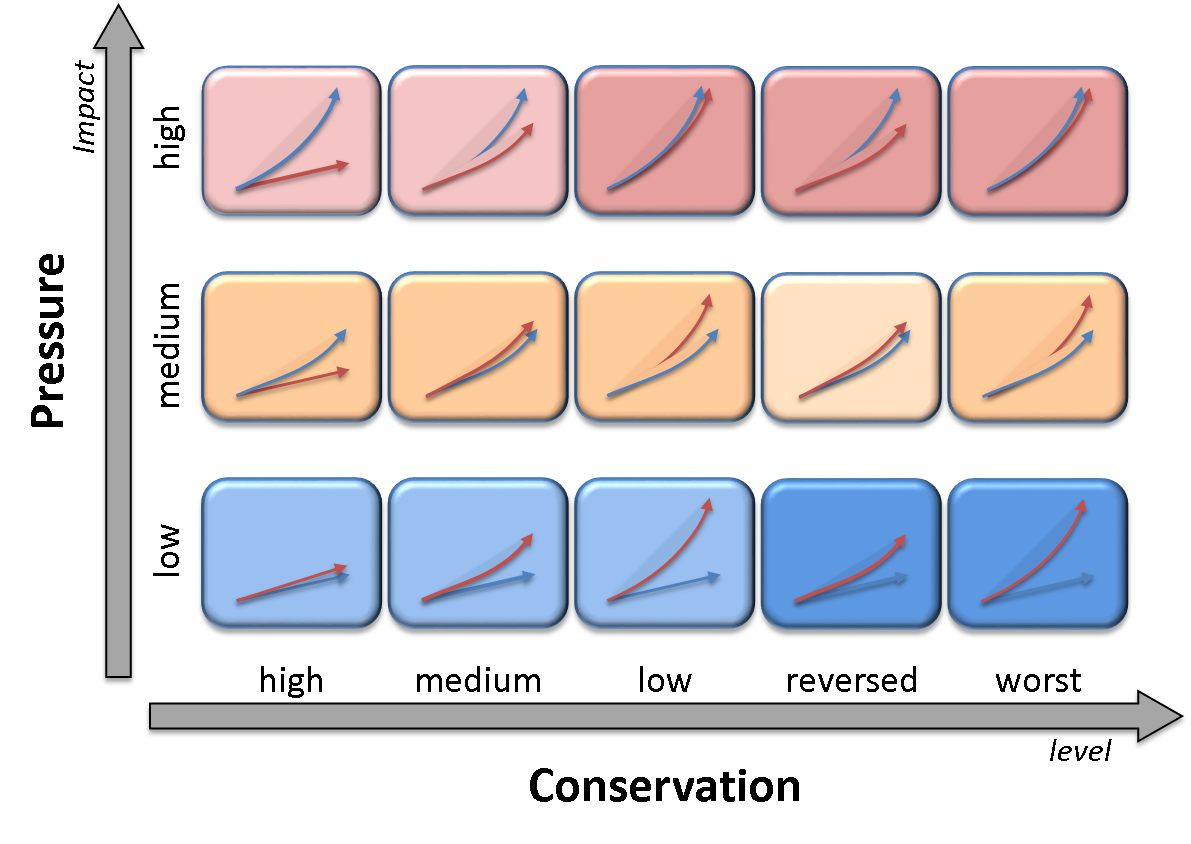 |
| Figure 1. Structure of the management strategy analysis. For each of the three scenarios clusters defined in the previous section (“High”,’ Medium’ and ‘Low’ pressure), we analyse the impact of the five management strategies discussed in the Section 8. Colours reflect the result of the cluster analysis carried out on the management strategies results. |
Following the structure used to analyse the scenario results, Figure 2 shows the violin plot of the state of all indicators (y axis) at the end of Ecospace simulation (2050), expressed as ratio of change over the value at the beginning of the simulation (2015). These end states now reflect the impact of the management strategies. To help the comparison, the violin plots obtained from the scenarios analysis (without management strategies) (coloured violins) are also included in Figure 2, to which the distributions from the scenario analysis (black and white violins) are superimposed.
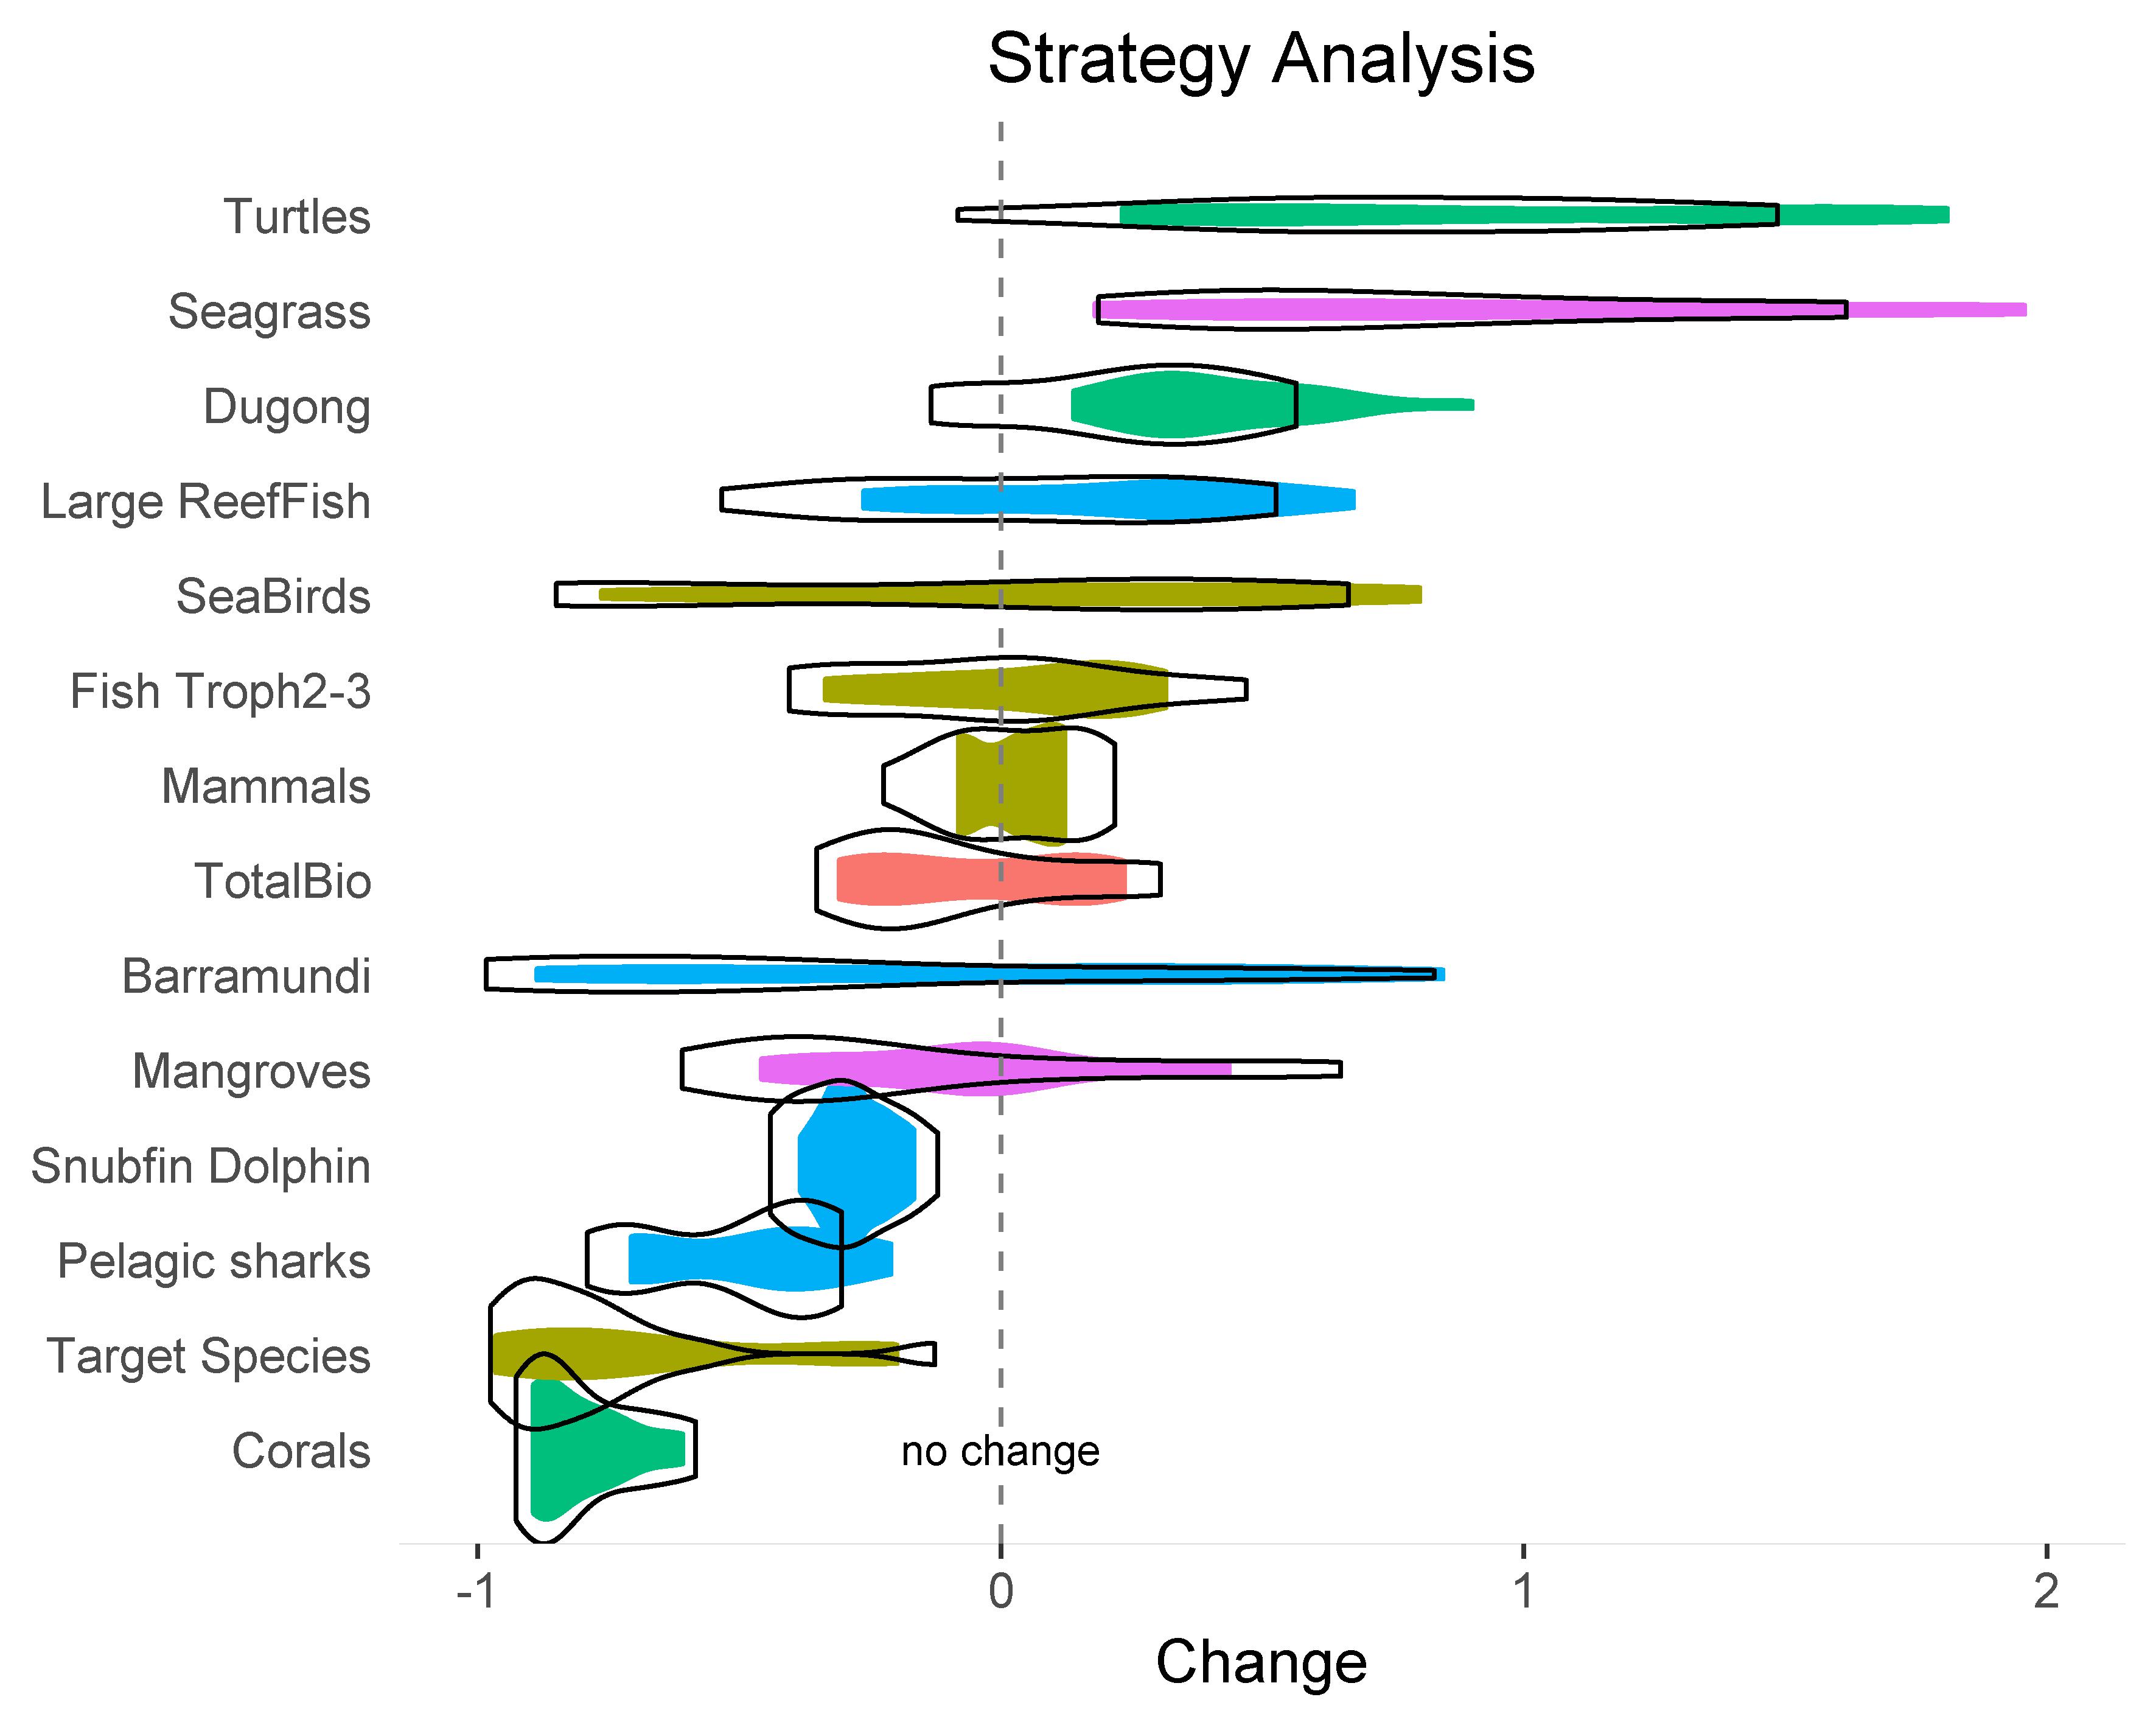 |
| Figure 3. Violin plot (black and white) of the state of all indicators (y axis) at the end of Ecosim simulation (2050), expressed as ratio of change over the value at the beginning of the simulation (2015). For each indicator, the violin plot summarises the distribution of the end states. To ease the comparison, we include here the violin plots from the scenario analysis (coloured violins). |
From a simple visual inspection of Figure 3 we note:
- No significant change in the 'winners' and 'losers' indicators can be found across the status quo or alternative management strategies.
- Some changes in the width of the distributions are noticeable. Mammals are more sensitive to strategies than scenario variability; and
- Overall, the most distributions move slightly to the left, indicating an overall decrease in biomass.
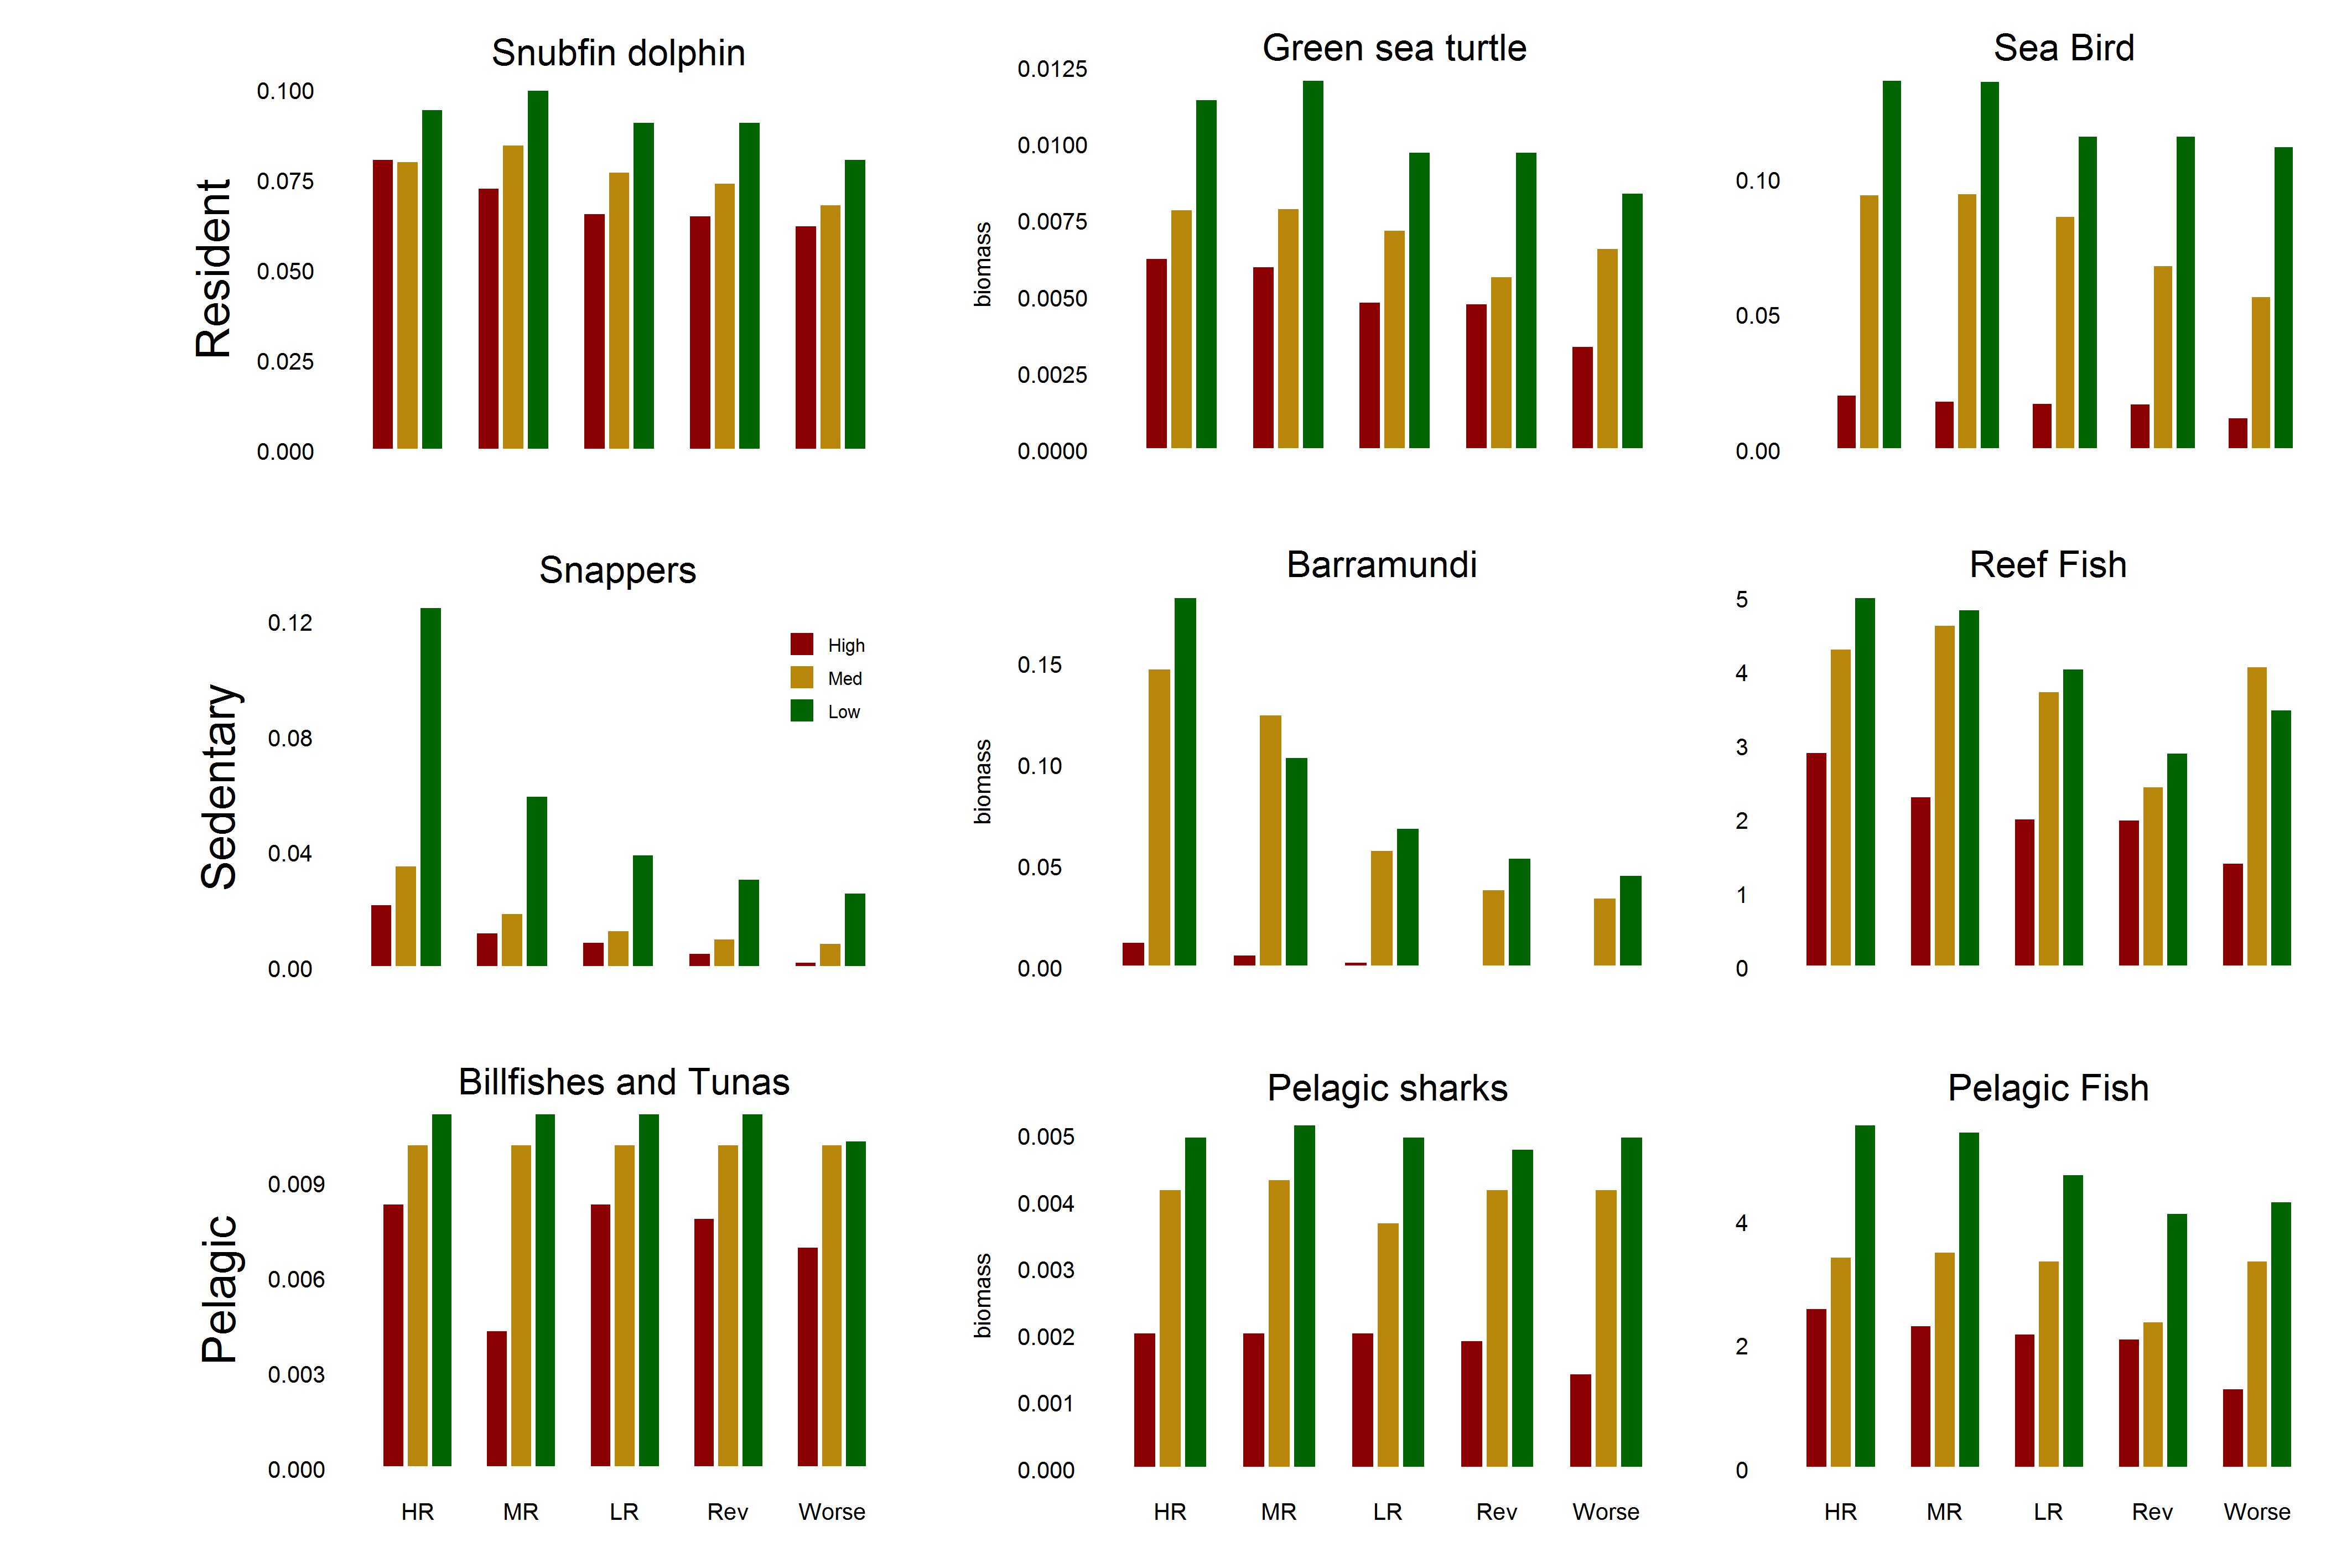 |
| Figure 4. Simulated changes in the absolute biomass of the functional groups at the end of simulations (2050) under different management strategies. Red, yellow and blue bars refer to ‘High’, ‘Medium’ and ‘Low’ pressure, respectively. Click here to view a larger figure |
The analysis of Figure 4 lleads to the following observations:
- The introduction of larger Sanctuary Zones (Medium and High management strategies, which include 20% to 30% increase in Sanctuary Zones compared to today) would benefit the total biomass;
- The marine parks effectiveness varies between functional groups. Marine parks appear more effective for relatively sedentary species such as reef fishes than for migratory species such as sharks, billfishes and tunas. Also, noticeable increments are shown for exploited species such as Barramundi, Snappers and Emperors. These results suggest that Sanctuary Zones within the marine parks are an important tool to meet conservation objectives (Figure 4); and
- While for most functional groups (and especially so for Snappers, Barramundi and Seabirds) the main impact in their overall biomass came from the ‘High pressure’ scenario. Different management strategies also showed significant impacts within each scenario. .
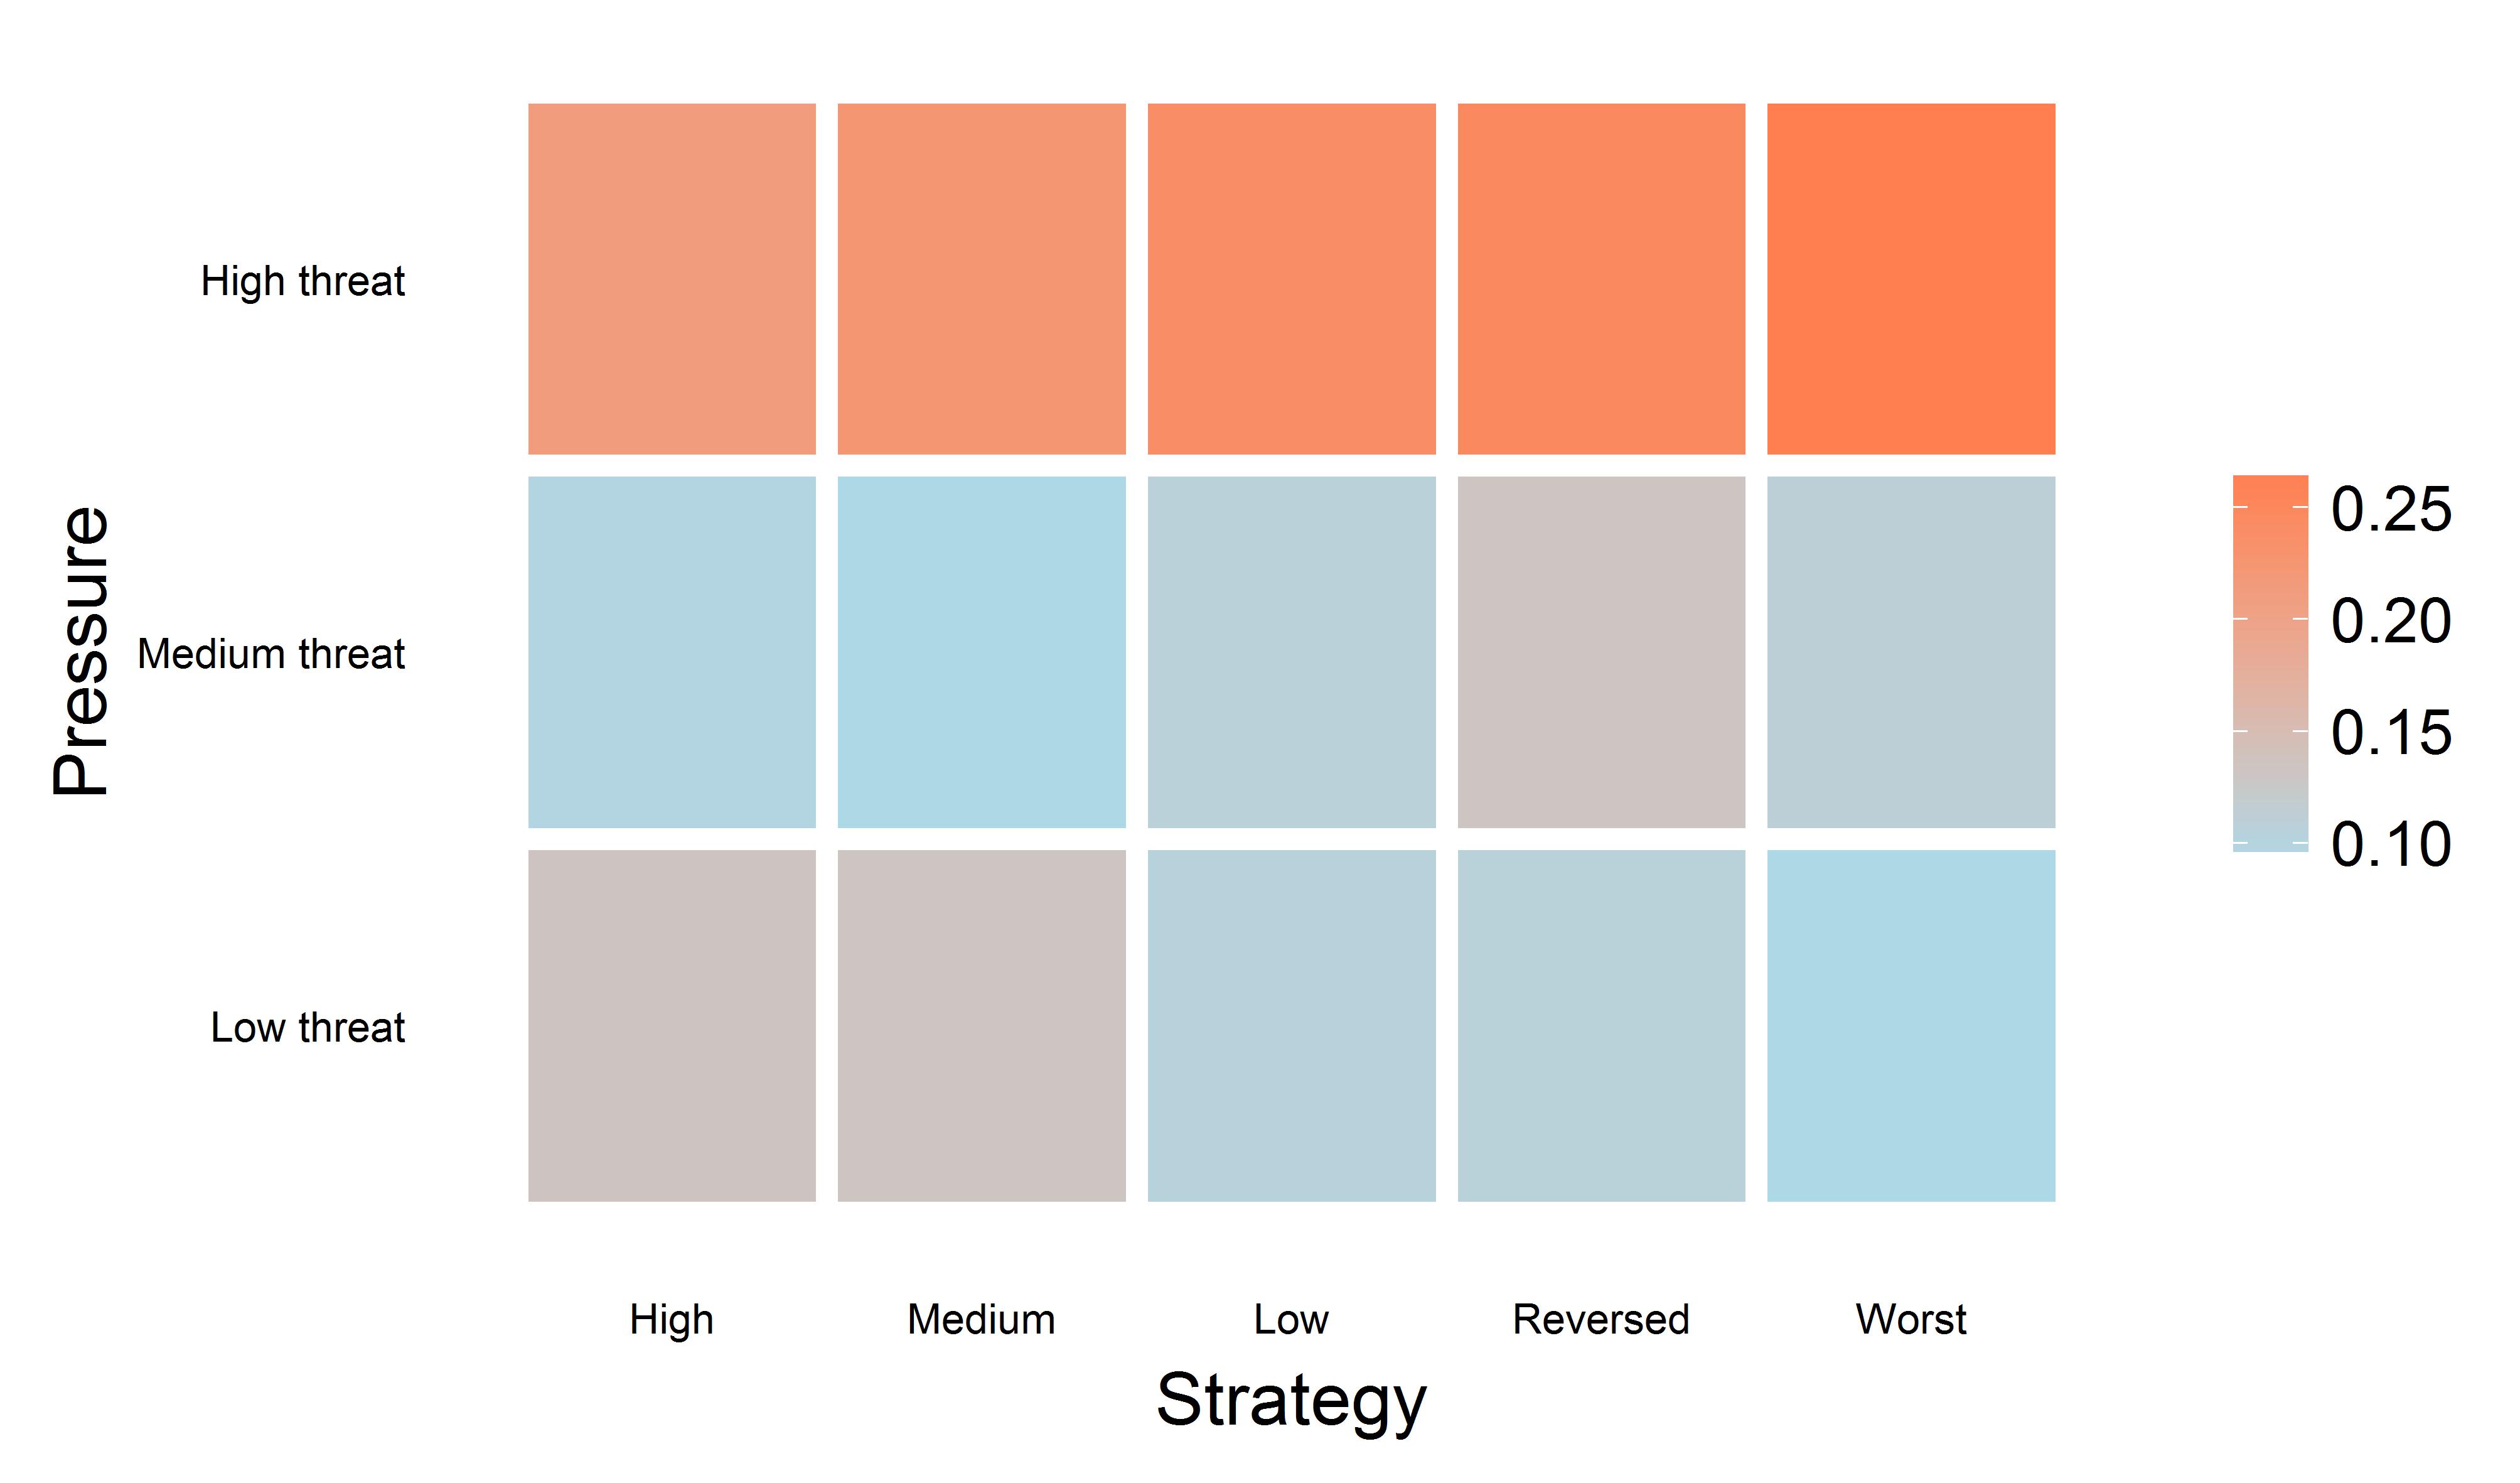
Finally, we have applied a cluster analysis the end states of the system under different management strategies, as we did for the scenario analysis. The results are shown in Figure 13, where different clusters are represented with different colours. The visual inspection of these clusters confirms the general results described so far in this section. Pressure due to different scenarios (‘High’, vs ‘Medium’ vs ‘Low’) still has a clear impact on the clustering (vertical differentiation). However, the effect of the management strategies is also noticeable (horizontal differentiation) especially in the ‘High’ and ‘Medium’ strategies on the one hand, vs the ‘Reversed’ and ‘Worst’ strategies on the other.
 |
| Figure 5. Ribbon time series of the Divergence and Total Divergence (Y axis on the left) and Total biomass (Y axis on the right). Divergence indicators measure the different between the state at year t (X axis) and the system at simulation start. Total biomass shows the ratio of the biomass change over the total biomass at simulation start. The dark lines show the mean of the indicators over all scenarios. The ribbons show the standard deviation over all scenarios |
Figure 5 shows the Total Divergence between the end states for each of the system under different management strategies the state of the system at the beginning of the simulations. Figure 16 reminds us once again how the impact due to warming is the main stressor the region is likely to have to address and that the efficacy of any strategy will largely depend on this.
To conclude this section, it is important to remind the reader that the reliability of these results needs to be verified with local biomass sampling inside and outside of the sanctuary zones. Assumptions about movements and migrations also need to be verified and biomass estimates improved. Overall, a better model parameterisation would allow better analysis of trends in target species such as Barramundi, Threadfin, Spanish mackerel, Snappers and Emperors. For example, the dispersal rates for most of these target species is difficult to estimate given sparse information on movement behaviour of species in the Kimberley region, although it is likely to have important effects on the overall outputs. An improved understanding on the biology of key species would also strengthen some of the assumptions in the model parameterisation employed in this study